
How to Open the Browser Console to Debug WordPress Issues (2026)
Introduction
A button stops working. A slider will not load. The block editor refuses to save. Nothing in the WordPress dashboard explains why. The answer is usually sitting in your browser console, and it takes about five seconds to open.
This guide shows you how to open the console, how to read what it says, and which WordPress problems it solves. You do not need to write code to use it. You only need to know what you are looking at.
What the Browser Console Is and Why It Helps
Every page on your site runs code inside the visitor’s browser. That code powers menus, sliders, pop-ups, form validation, cart updates and the block editor. When a piece of that code fails, the browser writes a note about it in a log. That log is the console.
The console lives in your browser’s developer tools. It is built in, so there is nothing to install. It is also read-only until you type in it, so opening it cannot break your site.
This matters because WordPress hides these failures from you. A broken script does not show a WordPress error message. The page simply loads with something missing or frozen. You are left guessing which plugin, theme or setting caused it.
The console removes the guessing. It names the error, and it names the exact file that produced it. Because WordPress keeps plugins in /wp-content/plugins/ and themes in /wp-content/themes/, that file path usually tells you the culprit straight away.
One more thing worth knowing. The console shows problems in the browser, not on the server. For server-side faults you need a different log, which the last sections of this guide cover.
How to Open the Console on Windows and Mac
There are three ways in, and all three land in the same place. Use whichever you remember.
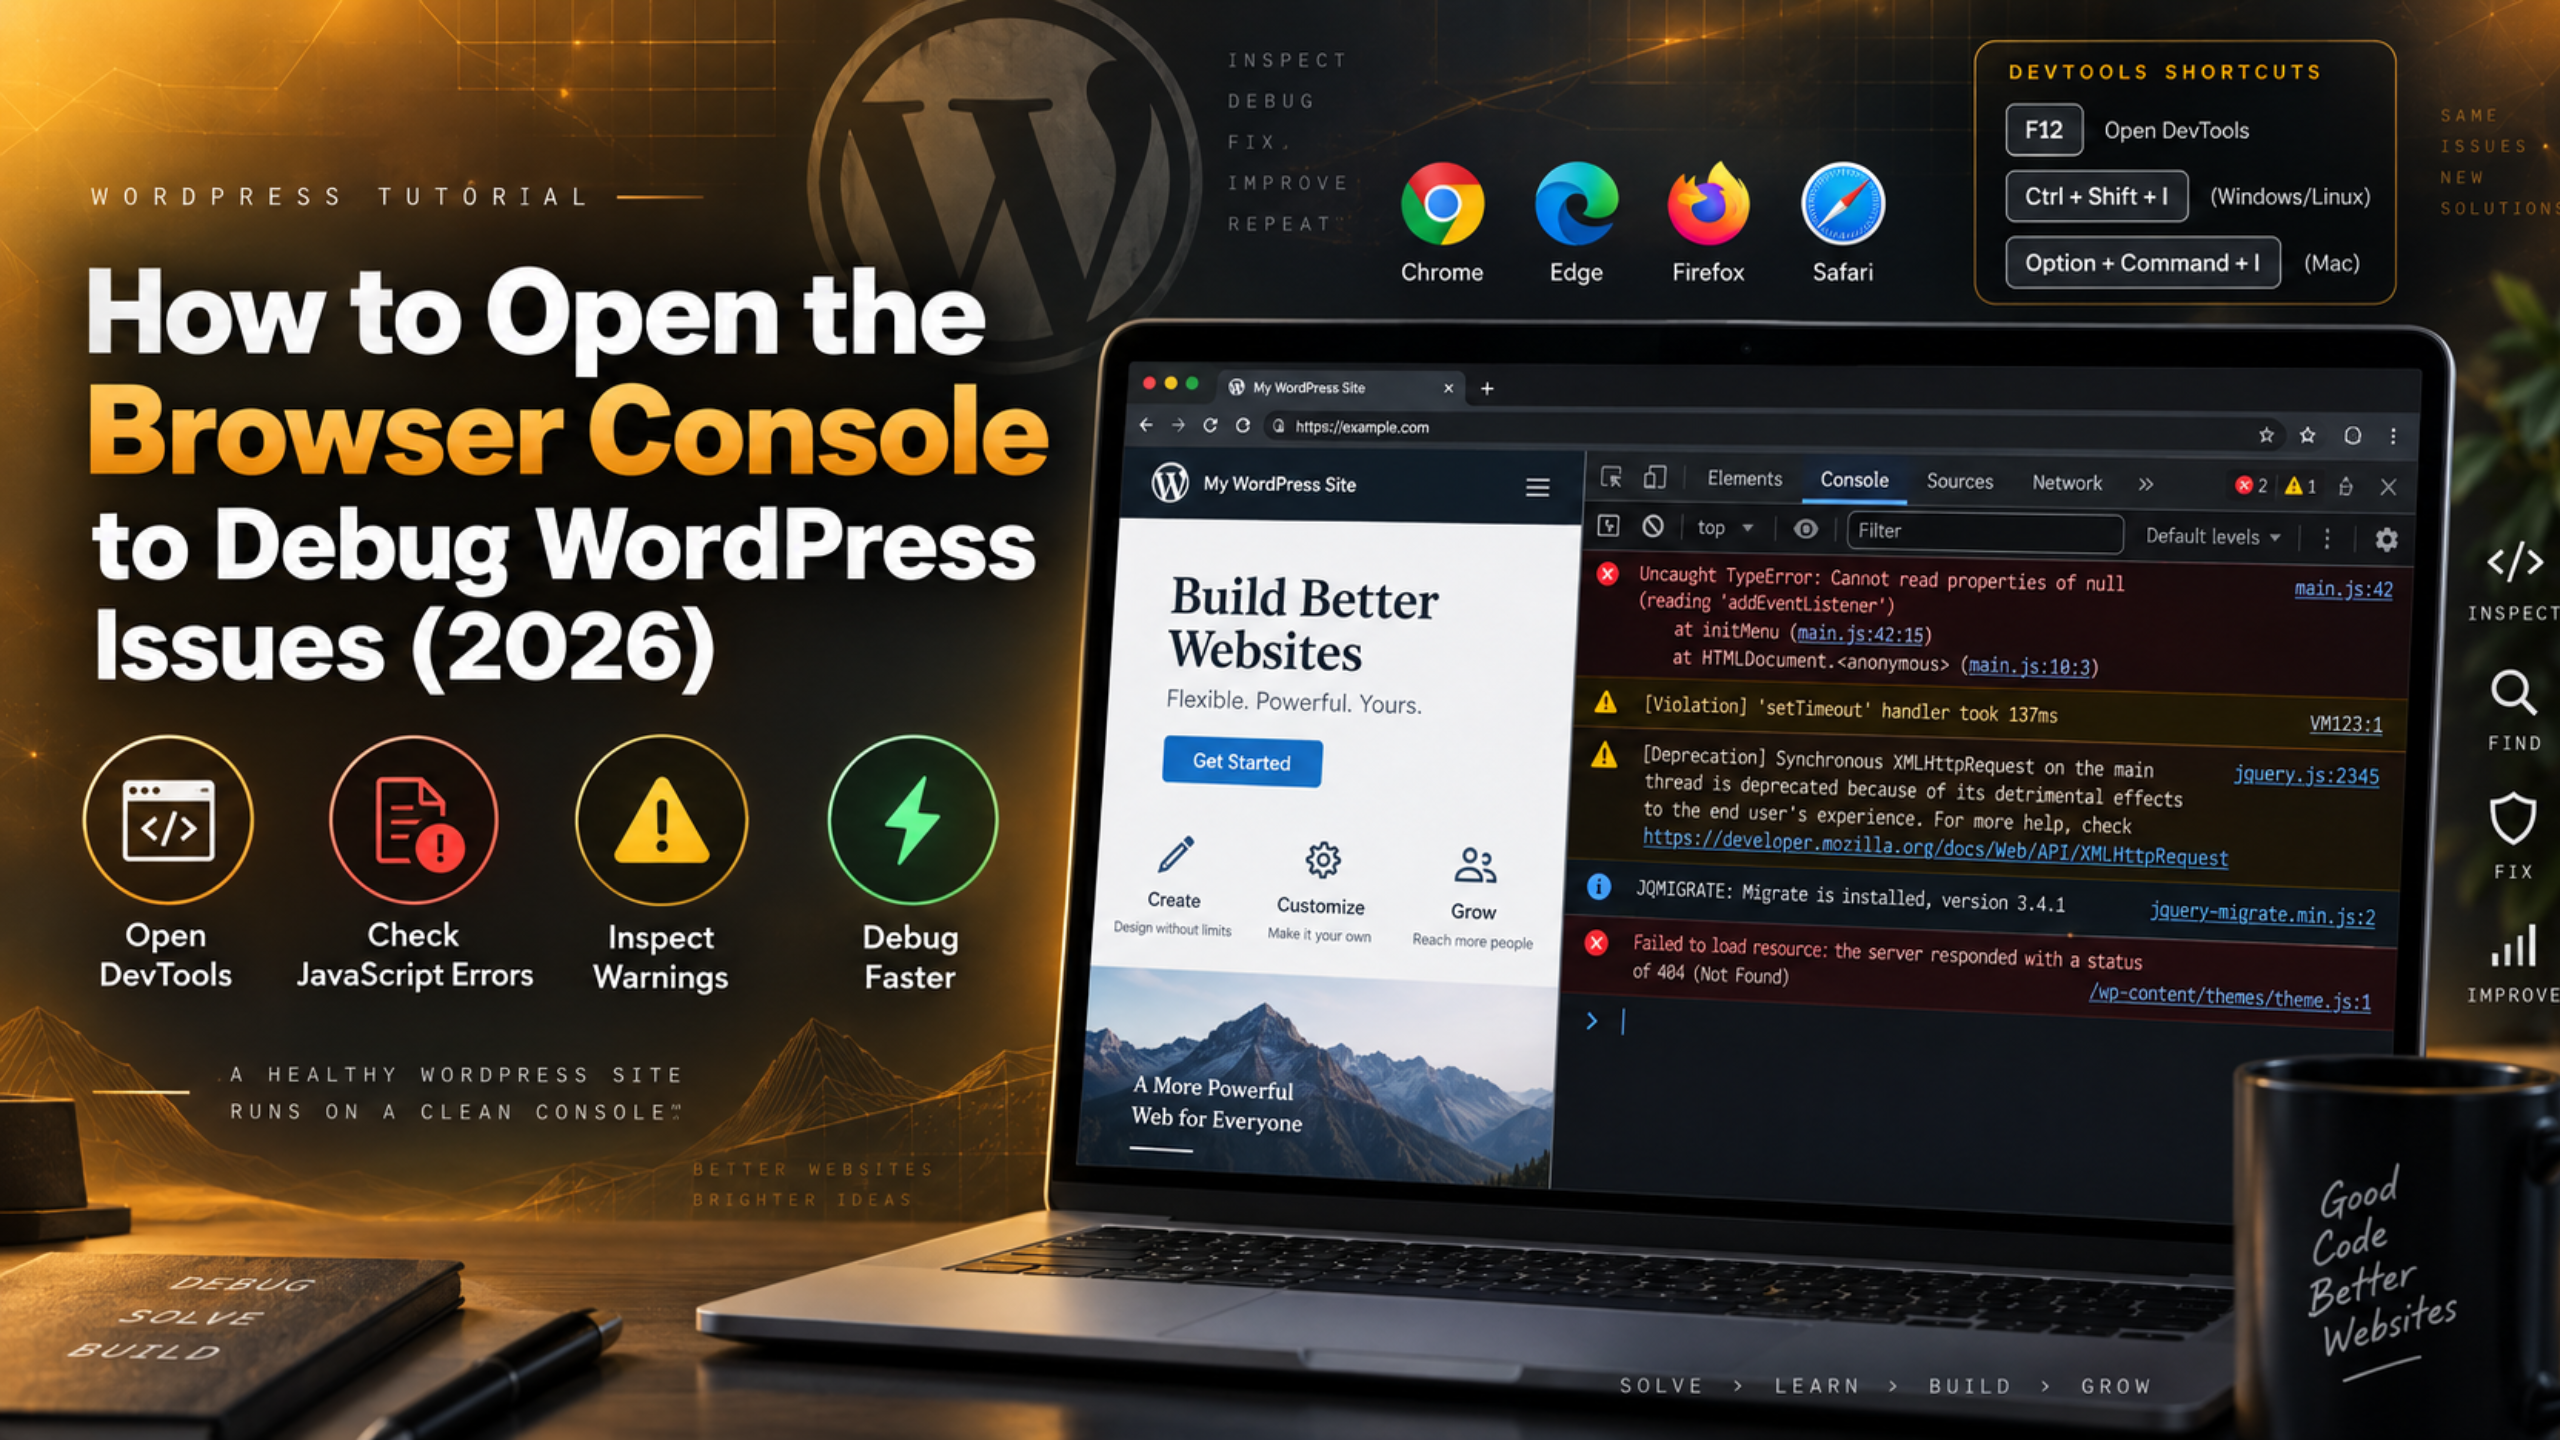
The keyboard shortcut. On Windows and Linux, press F12. On a Mac, press Cmd + Option + I. Developer tools open in a panel at the side or bottom of the window. Click the Console tab.
The right-click route. Right-click anywhere on the page and choose Inspect. This opens developer tools with the clicked element highlighted, which is handy when a specific button is misbehaving. Then switch to the Console tab.
Straight to the console. Most browsers have a shortcut that skips the other tabs. On Windows it is usually Ctrl + Shift + J, and on a Mac Cmd + Option + J. Some browsers use K instead of J, so try both.
If the Develop menu is hidden. A few browsers keep developer tools switched off until you enable them in preferences, usually under an Advanced section with a label about web developer features. Turn that on and the console becomes available from the menu bar.
On a phone or tablet. Mobile browsers have no console. The usual workaround is to reproduce the problem on a desktop browser and shrink the window, or use your desktop browser’s device toolbar to emulate a phone screen.
How to Read an Error Line in the Console
The console can look intimidating at first. It is mostly noise you can ignore. Focus on the red lines and you have already done the hard part.
Messages come in three levels. Red means an error: something failed. Yellow means a warning: something worked, but not cleanly. Plain grey or white lines are informational and usually harmless. Many sites show a handful of warnings and run perfectly.
Each red line has two useful parts. On the left is the error type and message. On the right is the file that caused it, plus a line number. A typical line reads like this:
Uncaught TypeError: $ is not a function
    slider.js?ver=2.4:118
The message tells you what went wrong. The file name and the number tell you where. Click the file name and the browser opens the code at that exact line.
Read the file path first. It is the fastest clue you will get. A path containing /wp-content/plugins/ followed by a folder name points at that plugin. A path containing /wp-content/themes/ points at your theme. A path pointing at a domain that is not yours points at an external script.
Ignore errors from extensions. Lines that begin with a browser extension address come from software in your own browser, not from your site. Test in a private window to filter them out.
The Console Errors WordPress Sites Throw Most Often
A small set of errors covers most real WordPress problems. Learning these few saves a lot of time.
Uncaught ReferenceError: jQuery is not defined. A script ran before the jQuery library was ready. It usually means a plugin or theme loaded its script in the wrong order, or that jQuery was removed or replaced somewhere in the site.
Uncaught TypeError: $ is not a function. WordPress loads jQuery in a protected mode where the $ shortcut is not available globally. Code written for other platforms often assumes it is. The plugin or theme author needs to use jQuery in full instead.
Failed to load resource: 404 (Not Found). A file the page asked for does not exist at that address. Common causes are a deleted plugin that left references behind, a renamed image, or a moved site with old paths still in the database.
Failed to load resource: 403 (Forbidden). The file exists, but the server refused to serve it. This is usually a permissions problem or a security rule blocking the request. Our guide to file and folder permission errors covers the correct values.
Mixed Content warnings. Your page loads over HTTPS but asks for an image, script or stylesheet over plain HTTP. Browsers block the insecure request. This is very common right after moving a site to HTTPS.
Uncaught SyntaxError: Unexpected token ‘<‘. The browser asked for a script and got HTML instead. Nearly always this means a PHP error page was returned where a JavaScript file should have been, so the real fault is on the server.
How the Network Tab Fills In the Gaps
The Console tells you that something failed. The Network tab, right next to it, tells you what the server actually sent back. Together they solve most cases.
Open the Network tab and reload the page. Every request appears as a row: the file name, its status code, its type, its size and how long it took. Sort or scan for red rows and non-200 status codes first.


Tick Preserve log before you reload. Without it, the list clears on every page change. That makes login redirects and form submissions almost impossible to trace, because the evidence disappears the moment the page moves.
Tick Disable cache too. This forces the browser to fetch fresh files while developer tools are open. Otherwise you may be debugging a cached copy of a file you already fixed.
Filter to XHR or Fetch. This hides images and stylesheets and shows only the background requests WordPress makes. Two names matter here. Requests to admin-ajax.php handle older plugin actions. Requests under /wp-json/ handle the REST API, which the block editor relies on.
Read the status code. A 500 means the server crashed handling that request. A 401 or 403 on a /wp-json/ request often explains why the editor cannot save. Our roundup of common block editor problems covers those cases.
Click any row for detail. The Response tab shows exactly what came back. A PHP warning sitting in that response is often the real answer.
How to Trace an Error Back to a Plugin or Theme
Finding the error is half the job. Proving what caused it is the other half. Work through these steps in order.
Step 1: read the file path. The error line already names a folder under /wp-content/. That is your first suspect, and it is right more often than not.
Step 2: rule yourself out. Open the page in a private window and test again. If the error vanishes, a browser extension or a stale cache caused it, not your site.
Step 3: clear every cache. Clear your caching layer, then hard reload with Ctrl + Shift + R or Cmd + Shift + R. Old combined script files cause errors that no longer exist in the source.
Step 4: test on a copy, not the live site. Before you deactivate anything, take a backup and work on a duplicate. Our guides on backing up and restoring WordPress and setting up a staging site cover both steps.
Step 5: deactivate the suspect. Turn off the plugin the path named, then reload with the console open. If the error is gone, you have your answer.
Step 6: if the path was unclear, test in halves. Deactivate half your plugins at once, then narrow down. Our guide to WordPress plugin conflicts explains the method in full.
Step 7: switch to a default theme. If no plugin is responsible, activate a default WordPress theme and test once more. An error that only appears with your own theme active belongs to the theme.
What the Console Cannot Show You
The console only sees the browser. A large share of WordPress problems never reach it, so knowing its limits stops you searching in the wrong place.
PHP errors are invisible here. Fatal errors, missing functions and version mismatches happen on the server before the page is sent. Turn on debugging to capture them instead. Our explainer on what WP_DEBUG is and how it works shows how, and the log lands in wp-content/debug.log. Add debug settings to wp-config.php only with a backup of that file saved first, because a typo there takes the whole site down.
Database faults are invisible too. A connection failure or a corrupted table stops WordPress before any script runs. See our fixes for error establishing a database connection and repairing a WordPress database.
Scheduled tasks leave no trace. Missed emails, unpublished scheduled posts and stalled imports are WP-Cron problems. They run on the server with no browser involved.
Environment problems need another screen. Outdated PHP, missing modules and failing loopback requests show up under Tools → Site Health. Our Site Health guide explains what each warning means.
Server errors need server logs. When the console reports a 500, the reason is in your PHP error log, not in the browser.
Console Habits That Save You Hours
Using the console well is mostly routine. A few habits turn it from a last resort into your first check.
Open it before you report a problem, not after. Reproduce the fault with the console open and you capture the error as it happens. Reload afterwards and the evidence may be gone.
Copy the error text exactly. Right-click the red line and copy it, including the file path and line number. A support request with the real error line gets solved far faster than one describing a button that does nothing.
Check the console after every update. Plugin, theme and core updates are the most common source of new script errors. A ten-second look at your homepage and one key template catches most of them early.
Test both logged in and logged out. Some scripts only load for administrators, and some only for visitors. An error your customers see may be invisible to you.
Keep the Network tab in mind. If the Console is clean but something still fails silently, the answer is almost always a failed request rather than broken code.
Know when to hand it over. The console tells you what broke. Fixing it can still mean touching theme files, server settings or the database, and those carry real risk on a live site. If the trail leads somewhere you would rather not go alone, 24×7 WP Support can take the error line you found and handle the repair, with backups taken first and round-the-clock monitoring after.

Brian is a WordPress support specialist and content contributor at 24×7 WP Support. He writes practical, easy-to-follow guides on WordPress troubleshooting, WooCommerce issues, plugin and theme errors, website security, migrations, performance optimization, and integrations. With a focus on solving real website problems, Brian helps business owners, bloggers, and online store managers keep their WordPress sites running smoothly.