
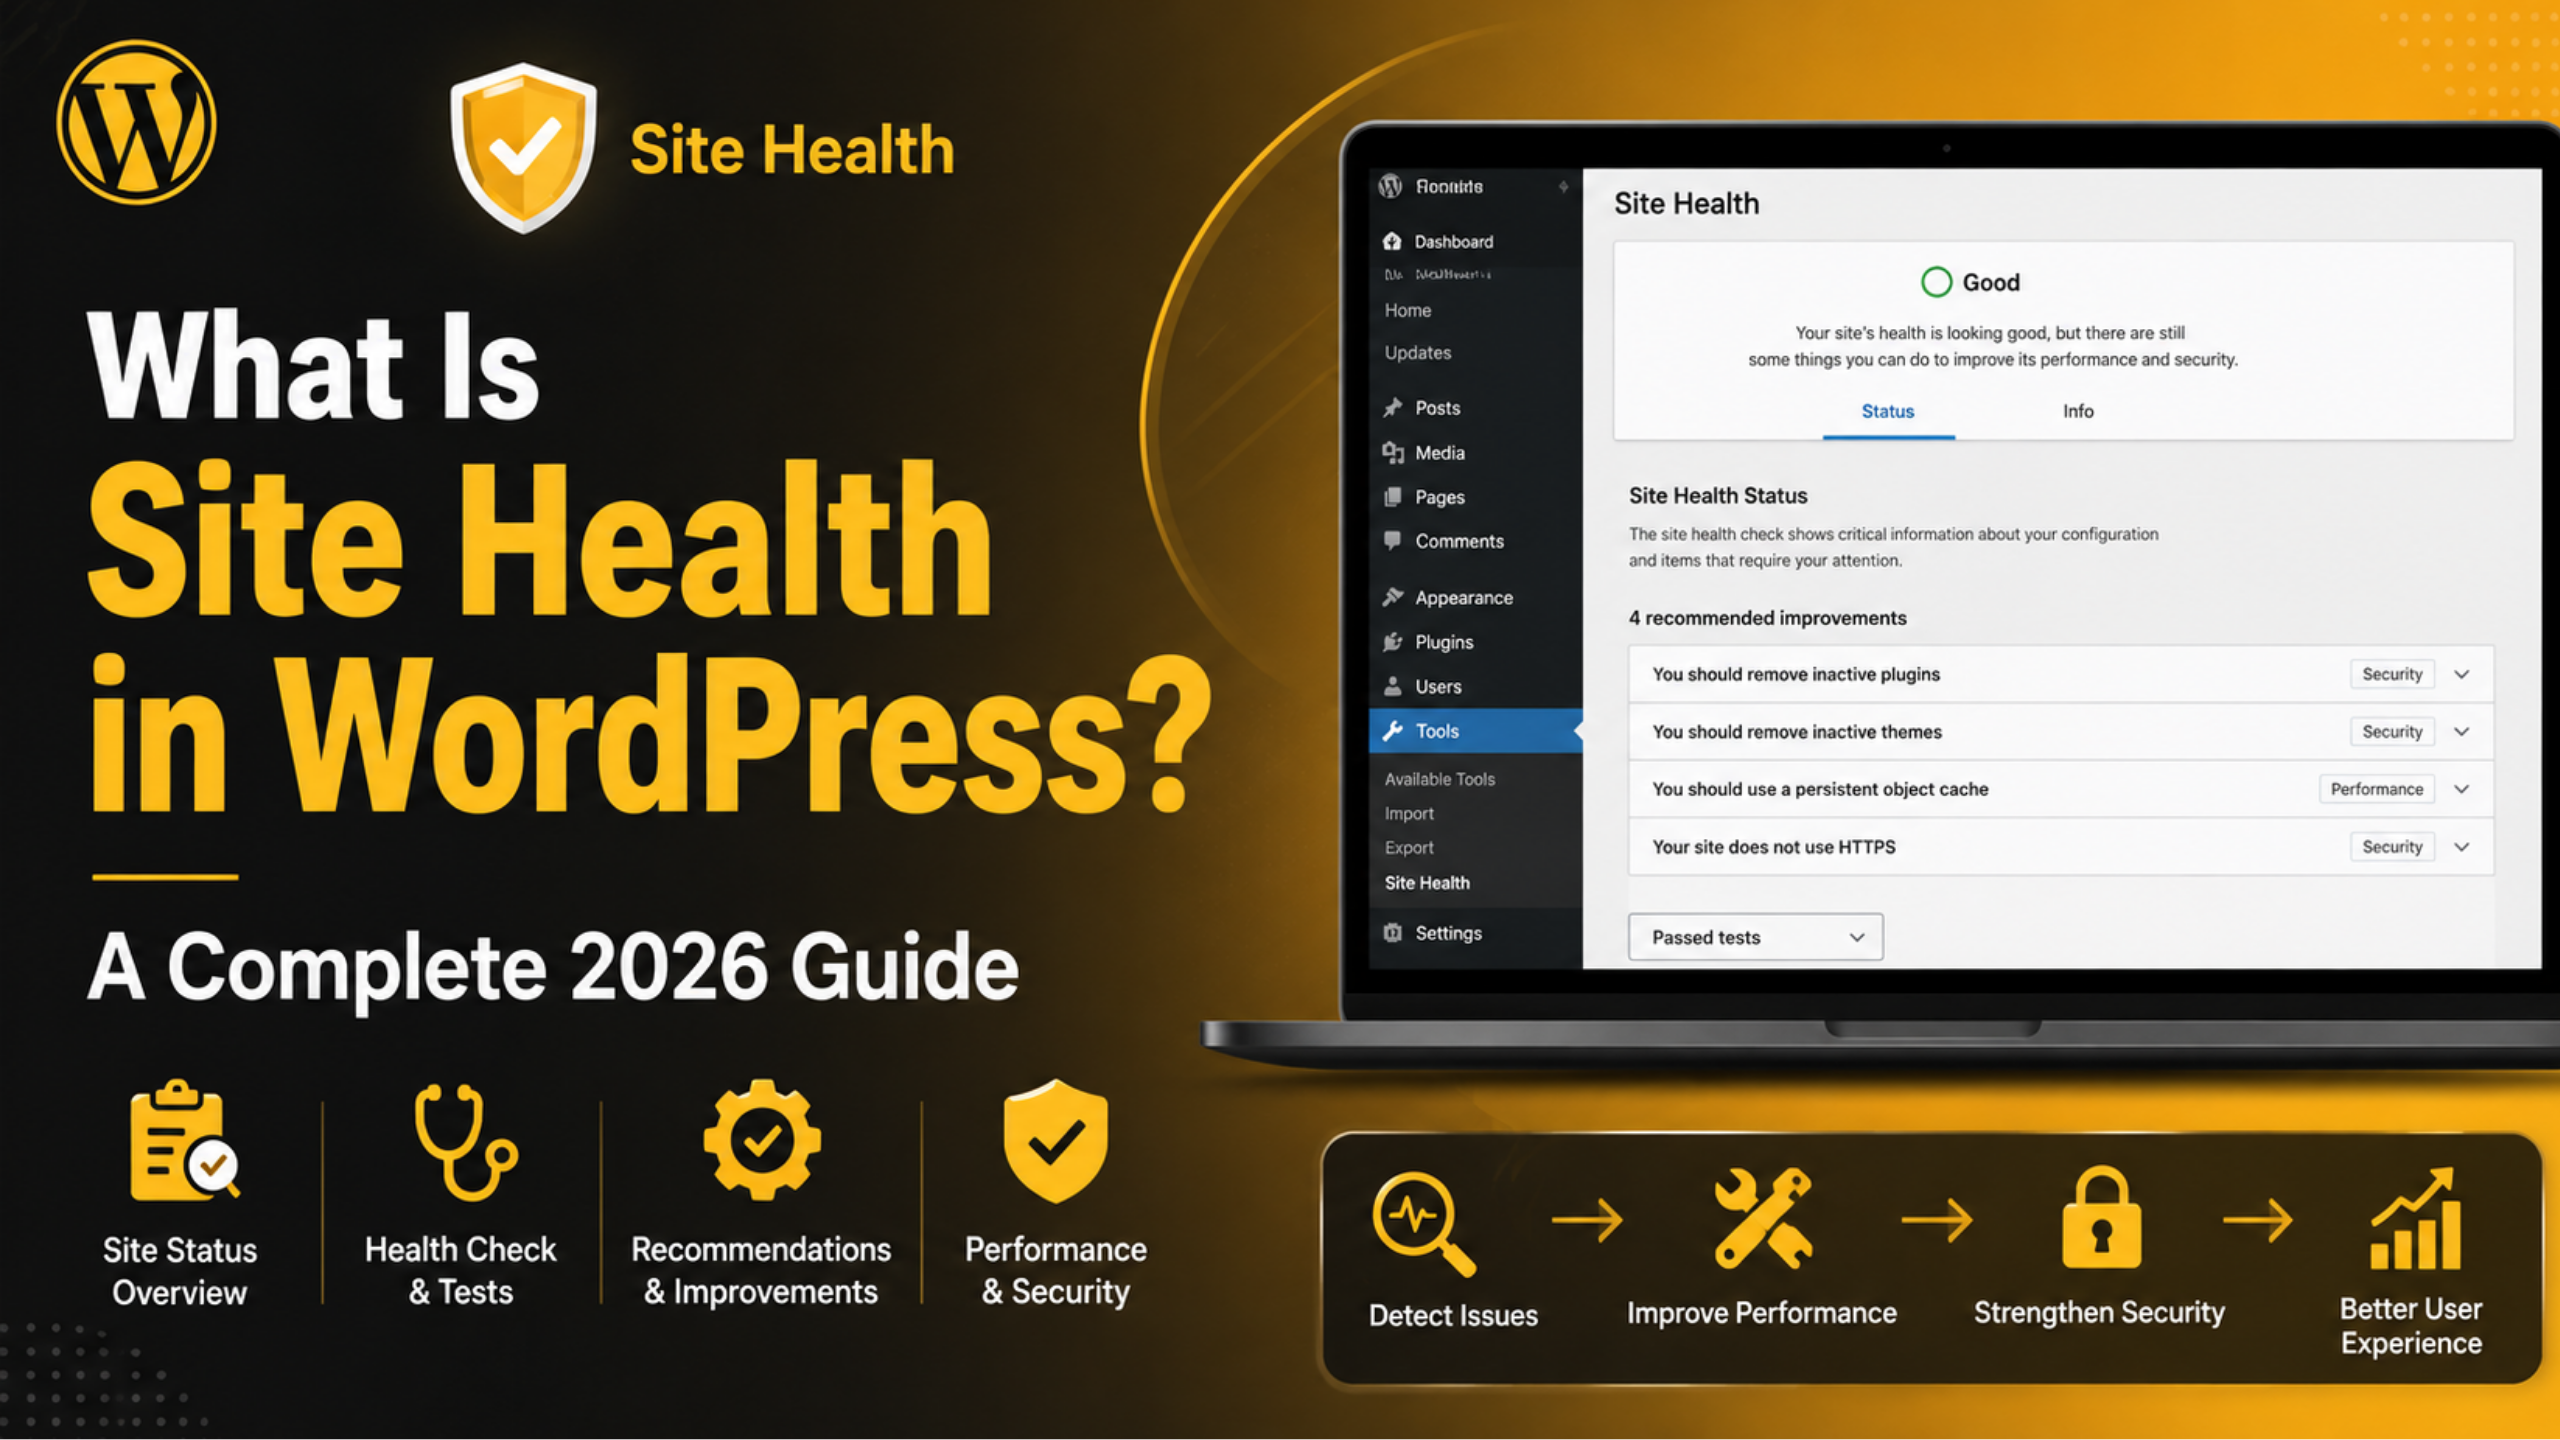
What Is Site Health in WordPress? A Complete 2026 Guide
Site Health is a free check-up tool built into WordPress. It looks at your server, your database and your active code. Then it tells you in plain words what works and what does not. You do not install anything. It is already there, waiting in your dashboard.
Most site owners never open it. That is a shame. It answers a question that used to need a support ticket: is my site set up the right way? In 2026 it checks a lot, from your PHP version to a bloated options table. This guide walks through every part of the screen. You will learn which warnings matter, how to fix the common ones, and what the tool misses.
Where to Find Site Health and What It Does
Site Health sits at Tools → Site Health in your WordPress admin. You need an administrator account to see it. On a multisite network, network admins get access. The direct link is your admin address plus site-health.php. Save that as a bookmark and you can jump straight there.
Cannot see the menu item? Two things usually cause that. Your user role may be too low. Or a plugin may be hiding the screen. Some hosts do this to cut support tickets. Ask your host, or check your role under Users.
The tool runs two kinds of test. Direct tests run the moment the page loads. They cover facts WordPress already knows. That means your PHP version, your database version, your WordPress version, and how many plugins sit unused. Background tests run a second later. They need your site to call itself or reach an outside server. Loopback checks, update checks and REST API checks all work this way.
This split matters when you troubleshoot. Say the screen stalls halfway. That is almost never a WordPress bug. It is a background test that never came back. The stall is itself a clue. It usually points at your host, a firewall, or a security plugin.
The Status Tab: How WordPress Grades Your Site
The Status tab is what most people mean by Site Health. At the top you see one short verdict. Your site is either “Good” or “Should be improved”. Below that sits a grouped list of findings. Older WordPress versions showed a percentage. That number is gone now. It made people chase a score instead of reading the advice.
Findings fall into three groups. Critical issues come first, marked in red. WordPress thinks these are hurting your security, speed or stability right now. Recommended improvements show in orange. Nothing is broken. You are just below current best practice. Passed tests hide at the bottom in a collapsed panel.
Open that passed panel at least once. It shows every check the tool ran and approved. That list is useful on its own. It tells you what WordPress considers healthy, which helps you read future reports faster.
Click any finding and it expands. You get a short reason and usually a clear next step. Treat red items as jobs for this week. Treat orange items as a backlog. Two orange notes and no red ones is a healthy site. Chasing a perfect board wastes time you could spend on content.
The Info Tab: Your Site’s Full Technical Profile
The Info tab lists your whole setup in one place. It is the fastest way to answer a support engineer. Everything sits in panels you click open. There is a panel for WordPress itself, one for your themes, and one for must-use plugins. Others cover active plugins, inactive plugins, media, the server, the database, file permissions and any constants in your config file.
The detail runs deep. The Server panel shows your PHP version, memory limit, max execution time, upload limit and loaded PHP extensions. The Database panel shows the server software, its version, the character set, the collation and your table prefix. The Filesystem panel tells you which folders WordPress can write to. That one detail explains a huge share of failed updates.
Look at the top right of the tab. There is a Copy site info to clipboard button. It builds a tidy plain-text report of the whole screen. Paste that into your first support message. It saves a full round of questions.
The report holds no passwords. It does list your software versions, though. That is useful to a helper and also useful to an attacker. So share it only with people you trust.
The Checks That Matter Most
Not every test carries the same weight. A small handful cause most real problems. Learn these few and you can read almost any Site Health report with confidence. Each one below touches security, speed, or your ability to update the site safely.
PHP Version
WordPress checks whether your PHP release is still supported. It warns loudly when it is not. This is the single most important line on the screen. Old PHP stops getting security patches. It also runs slower. In time, new plugin code simply will not work on it.
Most hosting control panels let you change the version yourself. It takes a minute. Take a backup first. Then confirm your theme and plugins support the new version. After the switch, check the result with our guide to checking your WordPress PHP version.
Loopback Requests and Scheduled Events
A loopback request is your site calling itself. WordPress needs this for the plugin and theme editors. It also needs it to run updates and scheduled jobs. When the test fails, look at four things. A security plugin may block self-requests. Your site address setting may be wrong. A server firewall may sit in the way. Or the whole site may be password protected.
You may also see a warning that scheduled events missed their time. That is the same problem wearing a different hat. Before you change anything, read our guide to how WP-Cron works and when to disable it.
HTTPS and Background Updates
Site Health checks that your site loads over HTTPS. It also checks that both your site address and home address use the secure prefix. A mismatch causes mixed-content warnings. It can even break your login page.
A second test asks whether WordPress can install its own security releases. That depends on file permissions, on outbound connections, and on no constant blocking updates. Both checks guard against the same danger. A site that quietly stops getting patches. Our wider WordPress security guide covers the hardening steps that go with these settings.


Caching and Autoloaded Options
Two speed checks show up on most sites. The first suggests a persistent object cache. It appears once your database passes certain size limits. At that point, repeated queries start to cost real time.
The second flags a heavy autoloaded options table. WordPress warns when plugins and themes load more than about 800 KB of options on every request. Neither item is an error. Both are hints. On a site with years of old plugins, they often explain a slow admin area. Our guide to optimising WordPress database performance shows how to clear out orphaned options safely.
How to Fix the Most Common Warnings
Most reports show the same short list. Each item has a fix that works. Work by severity, not by screen order. Change one thing at a time. That way you know what actually helped. And take a backup before you start.
“Your site could not complete a loopback request.” Turn off your security and firewall plugins one by one. Re-run the test after each one. When the warning clears, you have found the culprit. Add your own server address to that plugin’s allow list. If the warning stays with every plugin off, the block sits at server level. Ask your host to allow self-requests.
“The REST API encountered an error.” A plugin is usually sending broken output. Or a login layer is catching the request first. Check whether the site sits behind a login wall. Check for a maintenance mode plugin. Also check whether a cache is storing logged-in pages by mistake.
“You should remove inactive plugins and themes.” Unused code still sits on your server. It still needs patching. So this is a real risk, not tidying. Delete what you do not use. Keep one default theme for testing.
“Your site is running an outdated version of PHP.” Switch the version in your hosting panel. Then reload Site Health. The item should move into the passed list.
What Site Health Does Not Tell You
Site Health audits your setup. It does not watch your site. Knowing that gap stops you trusting a clean screen too much. It never scans for malware, so a hacked site can still pass every test. It never times a real page load, because it only reads settings.
It also knows nothing about your uptime, your backups or your rankings. It will not warn you that a plugin has a known flaw. The one exception is a plugin pulled from the directory, which does raise a flag.
The tool only runs when you open it. A problem that starts on Tuesday waits until your next visit. There is no email alert and no history. So you cannot tell if a warning is new or six months old. Anything urgent needs its own tool. That includes downtime, an expiring certificate, or a spike in failed logins.
One more thing to watch. Plugins can add their own checks to the screen. Some of those are really sales prompts for a paid upgrade. If the wording does not sound like core WordPress, find out which plugin added it first. For real speed numbers, pair this tool with a proper WordPress performance check.
Building a Practical Site Health Routine
The tool only pays off if you visit it on a schedule. Once a month suits a small brochure site. A busy shop or membership site deserves a look every two weeks. The habit matters more than the exact gap. Most of the value comes from spotting a change.
Here is a routine that works. Open the Status tab and read the red items first. Fix each one, or decide on purpose to live with it. Then skim the orange list and pick a single item for that month. Once a quarter, open the passed panel. Check that nothing has quietly slipped out of it. Finish on the Info tab. Copy the report and save it with the date in the filename.
That saved file is worth more than it looks. Something breaks three months later, and you have a record. You can see your old PHP version, your old memory limit and your old plugin list. Guesswork turns into a simple comparison.
Check the screen after any big change too. A host move, a PHP upgrade, a new cache layer, a theme swap. Those are the moments settings drift. Our guide to how much maintenance a WordPress site really needs puts this routine next to backups and updates.
Making Site Health Work for You in 2026
Think of Site Health as a free second opinion. It ships with your site and costs nothing to run. It will not replace monitoring, backups or a malware scanner. It will not tell you how fast your pages feel on a phone.
What it does brilliantly is catch quiet problems. An ageing PHP version. A blocked loopback. A swollen options table. These cause real damage precisely because nobody notices them. A five-minute read catches all three.
So open it today. Read the red items. Fix what you can. Save a dated copy of the Info report. Do that a few times a year and every future support chat starts with facts instead of guesses.
Some warnings are not worth solving alone. Failing loopback requests. REST API errors. A PHP upgrade on a site you cannot afford to break. Our team handles these every day. Talk to 24×7 WP Support and we will read your report, fix what is broken, and keep your site maintained.
Related posts:

What Is the WooCommerce Plugin in WordPress? A 2026 Beginner's Guide
How to Fix Chinese Characters Appearing on My Website in Google Search Results
Spectra vs Elementor: Which WordPress Builder Should You Choose?

Flodesk WooCommerce integration: Confused how to set up?
How Long Does WordPress Take to Publish Changes in 2026?

Brian is a WordPress support specialist and content contributor at 24×7 WP Support. He writes practical, easy-to-follow guides on WordPress troubleshooting, WooCommerce issues, plugin and theme errors, website security, migrations, performance optimization, and integrations. With a focus on solving real website problems, Brian helps business owners, bloggers, and online store managers keep their WordPress sites running smoothly.