
What Is WP_DEBUG in WordPress and How Does It Work?
Last updated on April 16th, 2026 at 09:39 am
Why WP_DEBUG Matters in WordPress
WordPress websites do not always show the real reason behind a problem. A page may stop loading, an update may break a feature, or a plugin may fail without a clear message. That makes troubleshooting slow and confusing, especially for website owners who need quick answers. This is where WordPress debug mode becomes useful. It helps WordPress reveal hidden technical issues that usually stay behind the screen.
Many users ask, what is WP_DEBUG in WordPress and why should they care about it. The answer is simple. WP_DEBUG is a built-in setting that helps detect errors, warnings, and notices on a WordPress site. It gives useful clues when something is not working properly. Instead of guessing, you can check what WordPress is reporting in the background. This saves time and helps you move in the right direction.
This setting matters during common support situations. A theme change may create a warning. A plugin update may trigger a conflict. A custom code snippet may break part of the website. In these cases, WP_DEBUG helps expose the source of the problem. It does not fix the issue by itself, but it makes the issue easier to understand.
What WP_DEBUG Actually Means
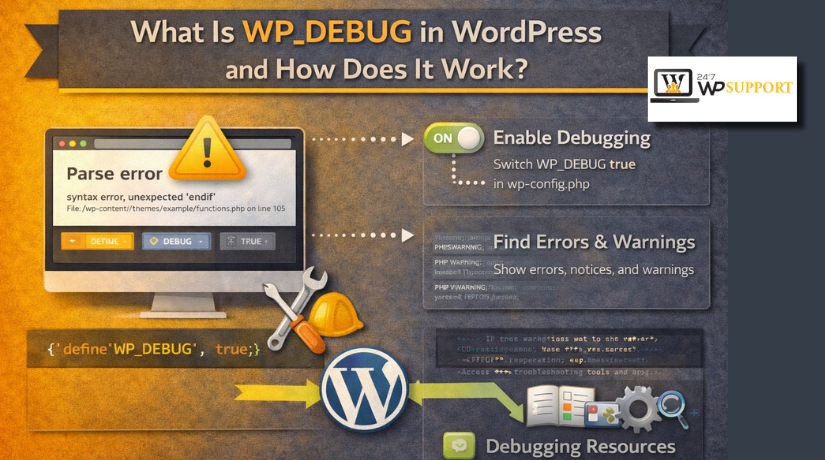
To understand what is WP_DEBUG in WordPress, think of it as a troubleshooting switch inside WordPress. It is a core WordPress constant used for error reporting. When it is turned on, WordPress starts showing technical messages that are hidden on most live websites. These messages can include PHP notices, warnings, and errors. They help you see what is going wrong and where the issue starts.
In simple words, WP_DEBUG gives you better visibility during troubleshooting. It shows problems linked to plugins, themes, or custom code. It can also highlight outdated functions and old coding methods that may cause issues later. That is one reason support teams and developers rely on it during testing and repair work.
WP_DEBUG is not a repair tool. It is a diagnostic tool. Its main job is to help you identify the real cause of a WordPress issue. Once you know where the error begins, fixing the problem becomes much easier. That is why this setting is important for anyone who wants to manage WordPress problems in a smarter way.
How WP_DEBUG Works Inside a WordPress Website
WP_DEBUG works through the wp-config.php file in WordPress. This file controls important site settings and tells WordPress how to behave. When WP_DEBUG is turned off, WordPress hides many notices and warnings. That helps keep a live site clean for visitors. However, hidden errors also make troubleshooting much harder.
When you enable this setting, WordPress starts reporting more technical details. These details may include PHP notices, warnings, and fatal errors. They often point to a plugin, theme file, or code line. This is why WordPress debug mode is useful during troubleshooting. It helps you see what is happening behind the page.
WP_DEBUG does not repair any issue on its own. Its main job is to reveal the real source. Once the error becomes visible, you can inspect it properly. This makes support work faster and more accurate.
It is also important to understand two common debugging actions:
- Display errors: Shows messages on the screen
- Log errors: Saves messages inside a debug file
This difference matters a lot during troubleshooting. On a test site, showing errors may help. On a live site, saving them privately is safer.
Where to Turn It On and the Safe Way to Enable It
If you want to know how to enable WP_DEBUG in WordPress, start with the wp-config.php file. This file is usually found in the main WordPress folder. Before making any change, create a full backup first. That gives you a safe recovery point if needed.
The best setup is not just turning on WP_DEBUG. You should also control how WordPress handles those messages. A safer method is to enable debugging, hide errors from visitors, and save them in a log file. This setup helps you investigate the problem without exposing technical details publicly.
A safe debugging setup usually follows this approach:
- Enable WP_DEBUG: Turns on error reporting.
- Hide front-end error display: Protects visitor experience.
- Save messages to log file: Helps review issues safely.
This is the most practical way to use debugging on a live website. It keeps the site looking normal while still collecting useful data. So, when learning how to enable WP_DEBUG in WordPress, always think about safety first. A careful setup makes debugging easier, cleaner, and more secure.
Understanding the Log File and What Gets Stored There
When debugging is active, WordPress can save errors in a log file. This file helps you review problems without showing them on screen. That is where WP_DEBUG_LOG WordPress settings become very useful. They allow WordPress to store technical messages for later review.
In most cases, the log file is created inside the wp-content folder. The file name is usually debug.log. This file becomes your main record during troubleshooting. It collects messages that help explain what failed and where it failed. That is why many support teams check the WordPress debug log first.
The log file can store different types of messages, such as:


- PHP notices
- PHP warnings
- Fatal errors
- Deprecated function messages
- Plugin or theme related error details
This logging method is helpful when an error does not appear clearly. Some issues happen during background tasks, admin actions, or hidden requests. In such cases, the website may look normal at first. Still, the WordPress debug log may record the real issue. It also helps track repeated problems over time.
Here is a simple view of what the log helps you do:
- Store hidden errors: Helps review issues safely.
- Track repeated warnings: Shows ongoing site problems.
- Record file and line details: Helps locate the source faster.
How to Read the Error Output and Find the Real Issue
Reading the log the right way is very important. A long error file can look confusing at first. Still, most entries contain clear clues if you read them carefully. Start by checking the first serious message in the file. That message often points to the real starting problem.
When reviewing the log, focus on these details:
- File path
- Plugin or theme name
- Line number
- Fatal error text
- Repeated warnings or notices
These details help you connect the issue to a specific source. For example, a plugin file name may appear again and again. A theme function may trigger the same warning after each page load. A line number may point directly to broken custom code. This is how how to fix WordPress errors using WP_DEBUG becomes easier in practice.
You should also know that not every message needs the same attention. Minor notices may not break the site right away. Fatal errors usually need faster action. So, read the log in order and focus on the most harmful entry first. That approach makes debugging clearer, faster, and more effective.
How WP_DEBUG Helps Troubleshoot Real WordPress Problems
WP_DEBUG becomes most useful when a website starts behaving strangely. A page may turn blank after an update. A plugin may stop working without warning. A theme function may fail after a small code change. In these moments, WordPress debug mode helps reveal what the site is doing behind the screen.
This setting helps you move from guessing to checking real details. Instead of trying random fixes, you can review the error source first. That is the main reason support teams use it during repair work. It helps identify the exact file, function, or plugin causing trouble.
Here are common problems where WP_DEBUG becomes helpful:
- White screen or critical error after a plugin update
- Theme function issue after editing template files
- Custom code warning inside functions.php or a snippet plugin
- Plugin conflict that breaks the admin area or front end
This is also where how to fix WordPress errors using WP_DEBUG becomes practical. You do not fix the problem by enabling debugging alone. You use the messages to understand what failed first. After that, you can disable a plugin, review a theme file, or remove broken code. This makes your troubleshooting process cleaner and more accurate.
Important Safety Note for Live Websites
Debugging should always be handled carefully on a live website. If error messages appear on public pages, visitors may see technical details. That can look unprofessional and may also expose useful site information. For that reason, errors should usually be saved privately in a log file.
A safer approach is simple:
- Use debugging only during testing or troubleshooting
- Avoid showing raw errors to public visitors
- Turn it off after the issue is resolved
This keeps your website safer and your visitor experience cleaner.
Conclusion
WP_DEBUG is a built-in WordPress tool for finding hidden errors. It helps you understand what is breaking your site and where the issue begins. From plugin conflicts to code warnings, it gives useful clues during support work. When used carefully, it can save time and reduce guesswork.
If you are still facing issues and need expert help, 24x7wpsupport can assist you with WordPress troubleshooting, error fixing, plugin conflicts, theme issues, and website support. Their team can help you identify the problem and get your website working smoothly again.
Related posts:
Why and How to Use Facebook Debugger to Fix Image Issues in Shared Posts?
How to Fix the Sidebar Below Content Error in WordPress
How to Fix WordPress Failed to Open Stream Error
Facing 429 Too Many Requests Error? Here is How You Can Deal with It
How to Fix White Text and Missing Buttons in WordPress Visual Editor

Brian is a WordPress support specialist and content contributor at 24×7 WP Support. He writes practical, easy-to-follow guides on WordPress troubleshooting, WooCommerce issues, plugin and theme errors, website security, migrations, performance optimization, and integrations. With a focus on solving real website problems, Brian helps business owners, bloggers, and online store managers keep their WordPress sites running smoothly.