
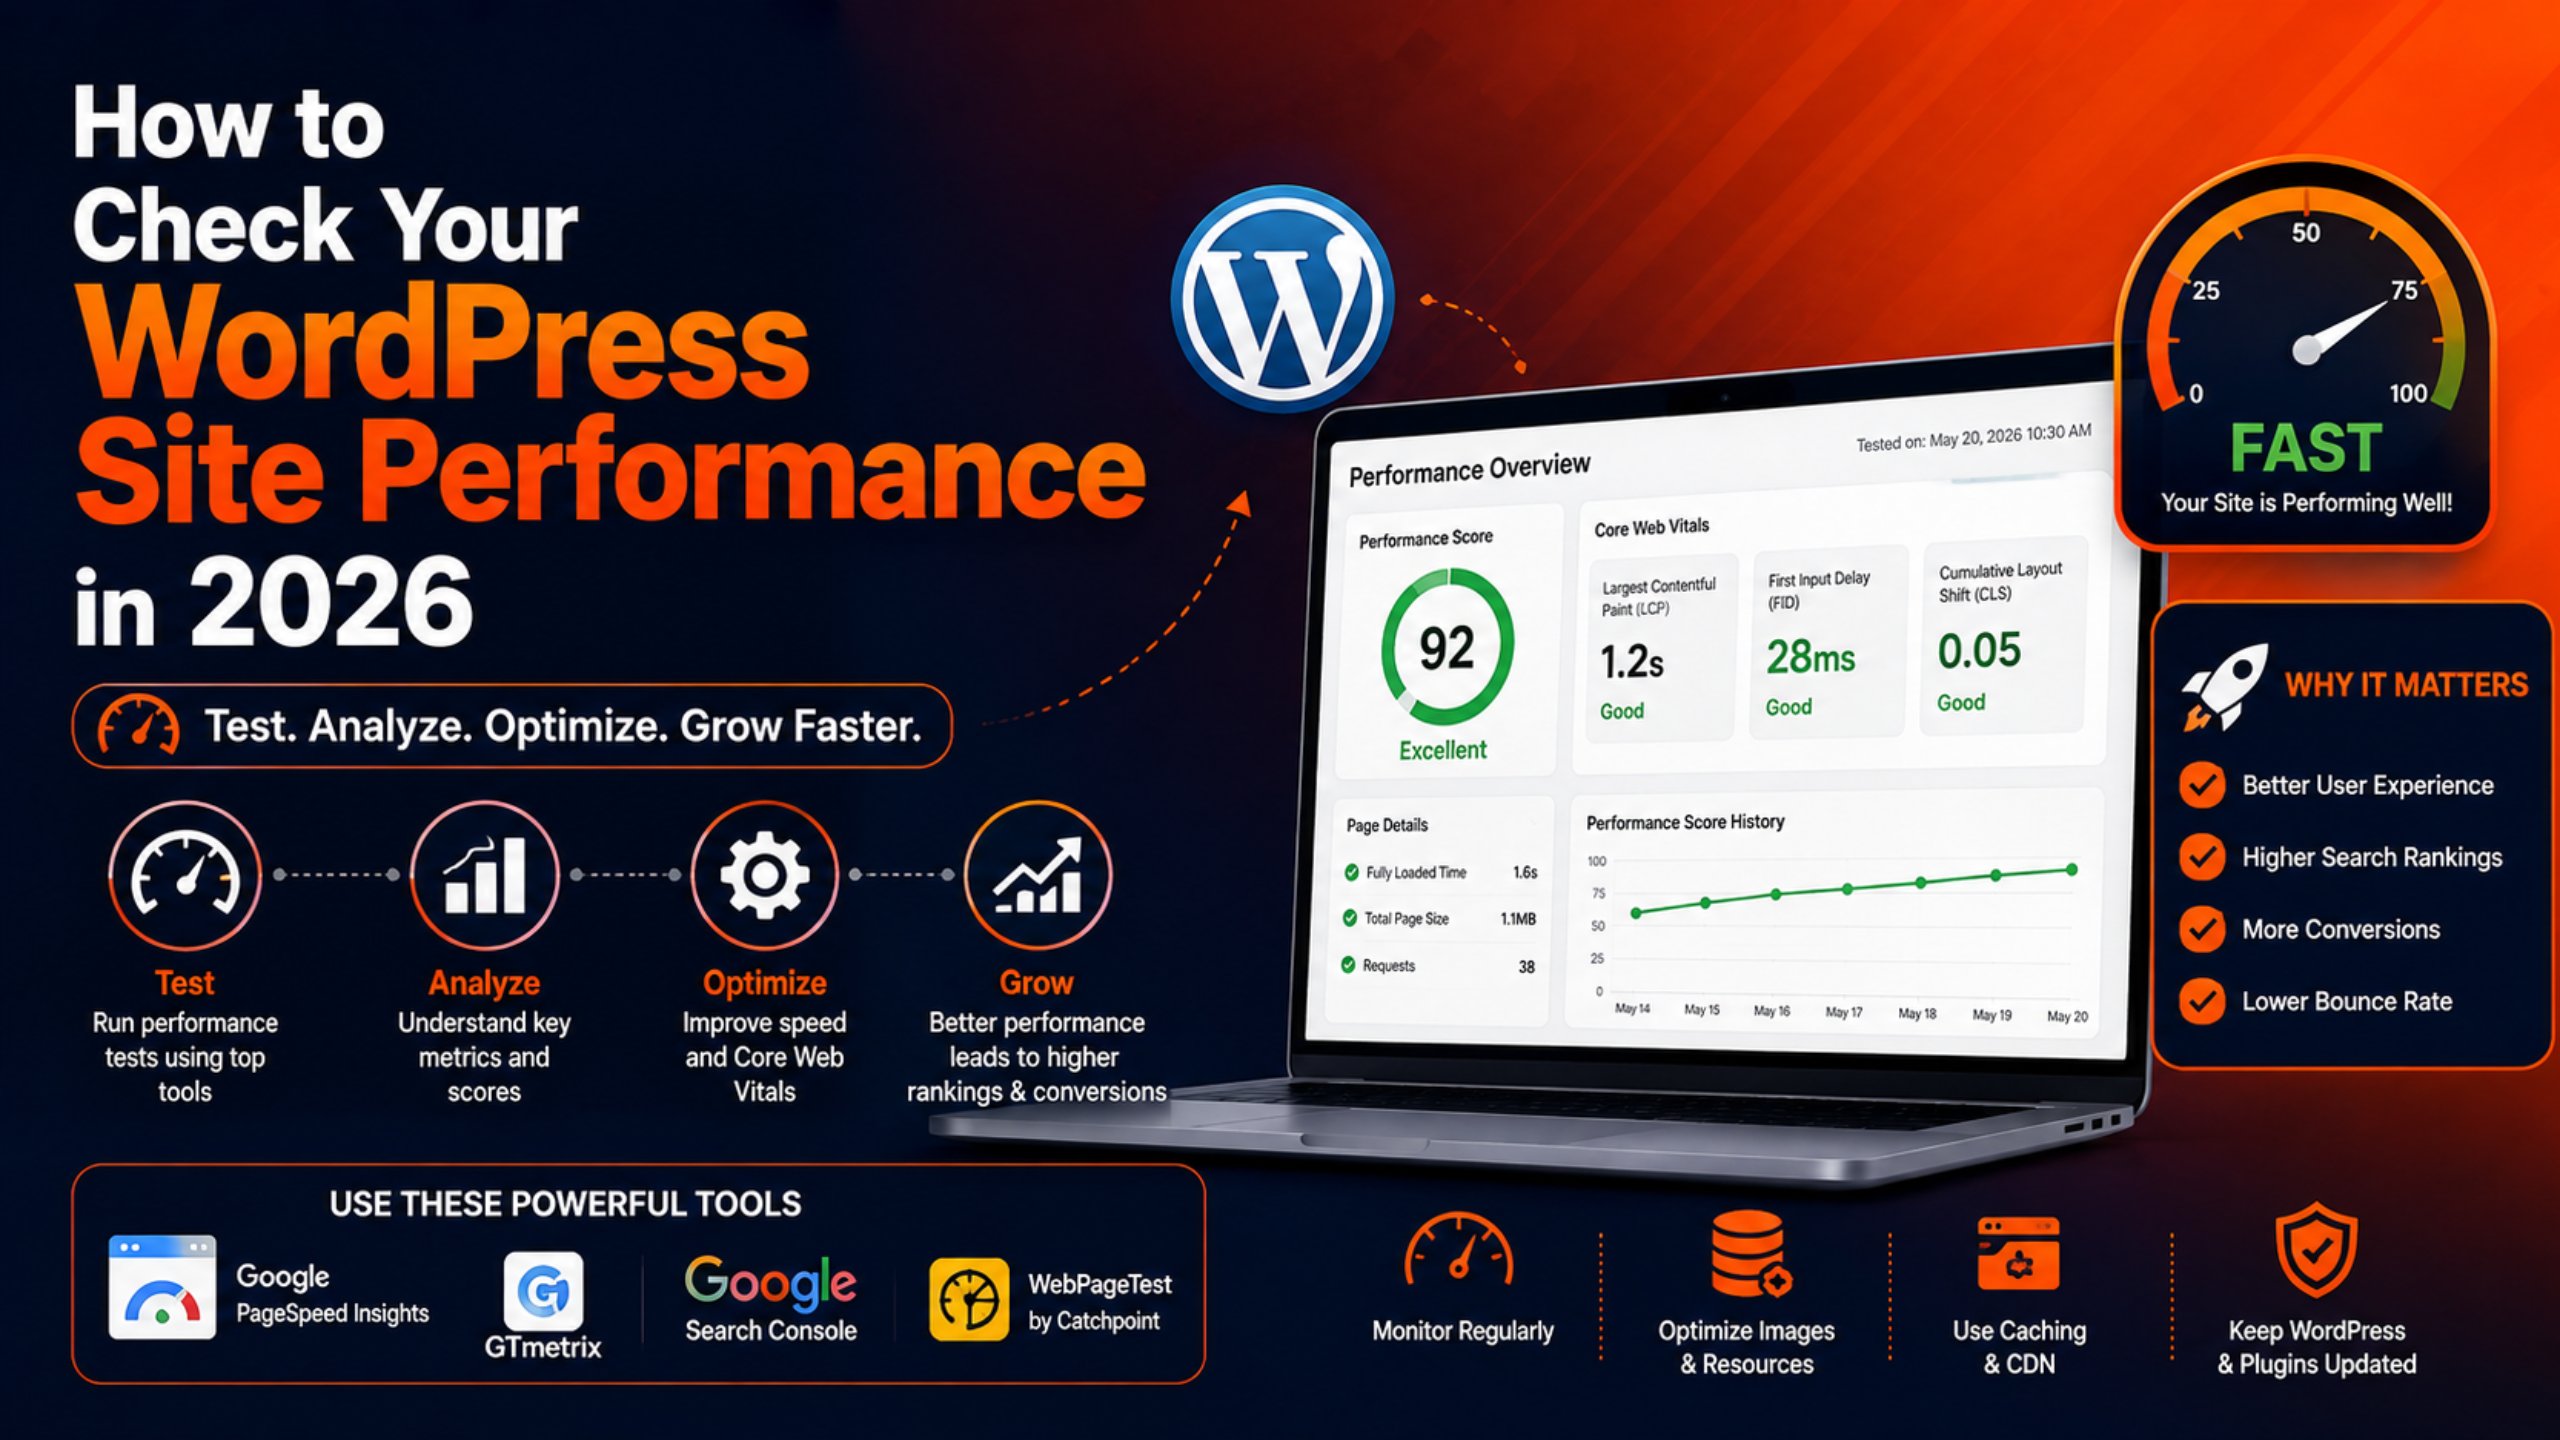
How to Check Your WordPress Site Performance in 2026
Your WordPress site can look perfect on your own screen. Yet it may still frustrate half of your visitors. The only way to know the truth is to measure it with real data. Guesswork is not enough.
Checking performance often tells you a lot. It shows whether pages load fast. It shows whether visitors can click without lag. It even shows whether search engines will reward or hurt your speed. This guide walks you through how to check your WordPress site performance in 2026. You will learn which numbers matter and how to act on them. You do not need to be a developer. You just need to know where to look.
What “Site Performance” Really Means
Performance is more than one loading-time number. It covers how fast content appears. It covers how quickly the page reacts to a click. It also covers how stable the page stays while it loads. Google groups the most important of these into a set called Core Web Vitals. These scores shape both user experience and search rankings.
There are three Core Web Vitals to know. The first is Largest Contentful Paint, or LCP. It measures how long the main content takes to show up. Aim for under 2.5 seconds. The second is Interaction to Next Paint, or INP. It measures how fast the page reacts when someone taps or clicks. Aim for under 200 milliseconds. The third is Cumulative Layout Shift, or CLS. It measures visual stability. Aim for under 0.1, so buttons and images do not jump around as the page loads.
INP is worth a special note. It is the current responsiveness metric. It replaced the older First Input Delay score. INP is stricter because it looks at every interaction, not just the first one. So a site that once felt fine may now need another look.
Keep an eye on three more numbers too. Watch your Time to First Byte, or TTFB. Watch your total page size. Watch the number of requests the browser must make. A page that weighs several megabytes will struggle. So will a page that fires off a hundred requests. Together these numbers give you the full picture, and each one points to a different fix.
Step 1: Run a Free Speed Test
The simplest place to start is Google’s own PageSpeed Insights. Paste your page URL and run the test. You get a score out of 100 for both mobile and desktop. You also get your Core Web Vitals and a list of tips to improve.
The tool shows two kinds of data. Lab data is one test run in a controlled setting. It is useful for debugging. Field data reflects real visitors over the past 28 days. That is the data search engines actually use. If your field data is missing, your page has simply not had enough traffic yet.
Do not chase the headline score alone. A page that scores 80 with healthy Core Web Vitals beats a page chasing a perfect 100. Want to go deeper on this tool? Read our explainer on what Google PageSpeed Insights is and why it matters.
Step 2: Read Your Core Web Vitals in Search Console
A single lab test only captures one moment. To see how your whole site performs for real people, open Google Search Console. Find the Core Web Vitals report. It sorts your URLs into “Good”, “Needs improvement”, and “Poor” groups. It does this for both mobile and desktop, based on real visits.
This report is the most reliable source. It uses the same data search engines weigh when they rank pages. Do many URLs sit in the “Poor” group? Then you likely have a site-wide issue. It could be slow hosting or a heavy theme, not a single bad page. Fix the shared cause and many pages improve at once.
The report also splits mobile and desktop results. This matters a lot. The same page can pass on desktop yet fail on mobile. Focus on the mobile column first, since that is what most visitors and search engines see. When a group is flagged, click into it. You will see the exact metric that failed. Then you know whether to chase speed, responsiveness, or stability.
Check this report at least once a month. It lags a couple of weeks behind your changes. So give each fix some time before you judge whether it worked.
Step 3: Measure Server Response Time (TTFB)
Time to First Byte measures one thing. It is how long your server takes to send the first piece of data after a request. It is a clear sign of whether your hosting is holding you back. Everything else on the page has to wait for that first byte.
A well-tuned server should return a TTFB under 200 milliseconds for cached pages. For dynamic pages that run PHP and query the database, aim for under 400 milliseconds. Is your TTFB often above 600 milliseconds? Then the problem is almost always the server or a lack of caching. It is rarely your images or scripts.
Page caching is the biggest lever here. It stores the finished HTML of each page. So WordPress does not have to run PHP and hit the database on every visit. That cuts TTFB sharply and improves LCP at the same time. Do your response times stay slow even after caching? Our guide on why a WordPress site is slow and how to diagnose it helps you find the cause.
Step 4: Use a Waterfall Test for a Deeper Look
Sometimes a summary score is not enough. A waterfall test breaks your page load into a timeline. It shows every file the browser downloads, in the order it happens. This visual “filmstrip” reveals which images, scripts, or fonts delay your main content.
Look for long bars early in the timeline. Watch for render-blocking scripts. Spot oversized images that push your LCP later. A waterfall view quickly shows the culprit. It may be one bloated file, a slow embed, or too many separate requests.


Run the test more than once. The first load may hit an uncached version of your page. Later loads show the cached version most visitors get. Compare the two, and you learn how well your caching works.
Pay attention to the fonts and third-party scripts too. Custom fonts can block text from showing right away. Tracking and chat scripts add extra requests that you may not need. Trim the ones that add little value. Each one you remove shaves time off the load.
Step 5: Check Performance From Inside WordPress
Some slowdowns start on the server side, inside WordPress itself. A database can grow bloated over time. It fills with post revisions, expired data, and leftovers from removed plugins. That quiet weight can drag down every page. Cleaning it often gives an instant lift, as our walkthrough on optimising WordPress database performance explains.
Your PHP version matters just as much. Newer releases of PHP handle requests far faster than old ones. An outdated version can slow an otherwise solid site. It takes only a minute to check your WordPress PHP version. Make sure you run a modern, supported release.
A slow admin dashboard is another warning sign. Does the back end feel heavy? Too many active plugins or an overloaded server may be to blame. If so, the front end is likely affected too.
Step 6: Always Test on Mobile
Most traffic now arrives on phones. Mobile networks are slower and less predictable than office broadband. A page that feels instant on your laptop can crawl on a mid-range phone. So mobile results deserve more weight than desktop ones.
Every major testing tool lets you switch to a mobile profile. It mimics a slower processor and network. Run your key pages this way. It is closer to what a real visitor sees. Search engines also index and rank mostly on the mobile version of your site.
Where you can, load your site on a real, older phone as well. Simulations help, but nothing beats the real thing. You want to see the genuine experience on the kind of device many visitors own.
Step 7: Reduce What Slows You Down
Testing only pays off when it leads to action. Once you know your numbers, fix the biggest problems first. Turn on page caching. Compress and resize your images. Remove plugins you no longer use. These three moves solve most common WordPress speed problems.
A content delivery network is another strong step. It helps most when you have visitors in different regions. A CDN stores copies of your files closer to users, so they download faster. Our list of free CDN options for WordPress is a good place to start.
Work from the largest wins down to the small ones. Fix hosting and caching first. Then tackle your biggest images. Save the tiny tweaks for last. Chasing small gains before the big ones is the most common way people waste time.
How Often Should You Check?
Performance is not a one-time job. Check your Core Web Vitals report each month. This catches slow decline before it hurts your rankings. Beyond that routine, always test after a big change. That includes a new theme, a batch of plugin updates, a redesign, or a hosting move.
Set a simple benchmark for yourself. For example, aim for LCP under 2.5 seconds and TTFB under 400 milliseconds. Treat any page that drifts past it as a signal to look closer. Steady speed matters more than a perfect score. A site that stays fast will always beat one that swings between quick and slow.
Keep Your WordPress Site Fast Year-Round
Checking your WordPress site performance comes down to a few repeatable steps. Run a speed test. Read your real-world Core Web Vitals. Measure server response time. Dig into a waterfall when you need to. Look inside WordPress. And always test on mobile. Do this often, and you will catch problems while they are still small.
Are the numbers still stubbornly slow? Would you rather an expert handled it for you? The team at 24×7 WP Support can audit your site, tune your hosting and caching, and keep it fast around the clock. Reach out today. Let us handle the performance so you can focus on your business.

Brian is a WordPress support specialist and content contributor at 24×7 WP Support. He writes practical, easy-to-follow guides on WordPress troubleshooting, WooCommerce issues, plugin and theme errors, website security, migrations, performance optimization, and integrations. With a focus on solving real website problems, Brian helps business owners, bloggers, and online store managers keep their WordPress sites running smoothly.